What does my step function look like?#
To plot our step function sf from the previous tutorial is straightforward:
In [1]: sf.plot();
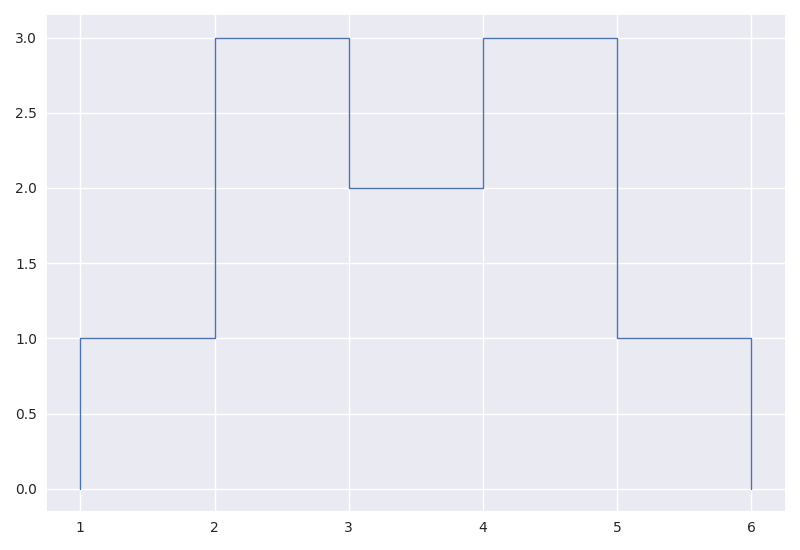
Compare this to the result of staircase.Stairs.to_frame().
In [2]: sf.to_frame()
Out[2]:
  start  end  value
0  -inf    1      0
1     1    2      1
2     2    3      3
3     3    4      2
4     4    5      3
5     5    6      1
6     6  inf      0
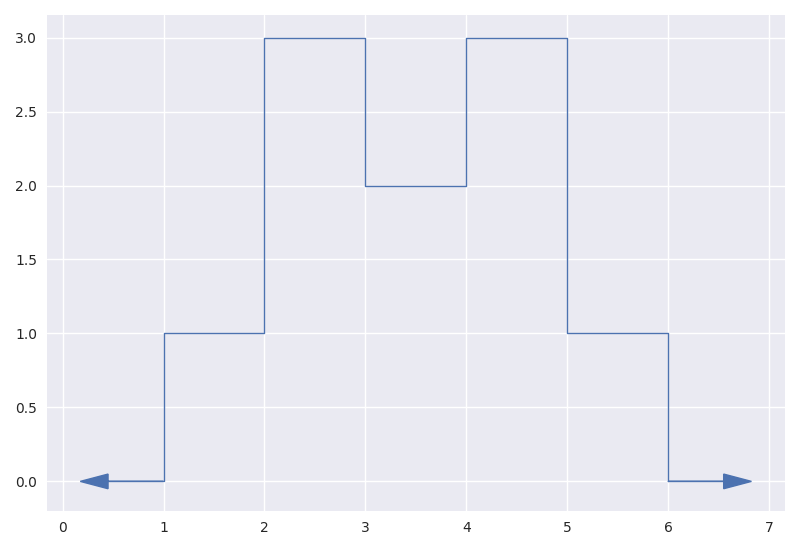
We can see that the first, and last, intervals in our step function have infinite length. Such intervals cannot be plotted, of course, however we can use the arrows parameter to indicate they exist.
In [3]: sf.plot(arrows=True);
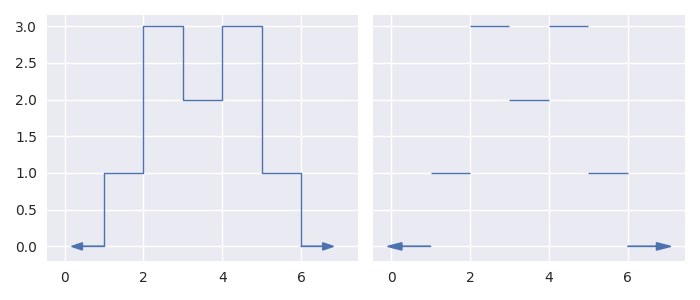
Another stylistic choice is whether to connect adjacent intervals with vertical lines or not. This can be achieved with the style parameter. matplotlib provides the backend for plotting and we can make use of the ax parameter to pass in a matplotlib.axes.Axes argument.
In [4]: fig, axes = plt.subplots(ncols=2, figsize=(7,3), sharey=True, sharex=True, tight_layout=True)

In [5]: sf.plot(ax=axes[0], arrows=True, style="step");

In [6]: sf.plot(ax=axes[1], arrows=True, style="hlines");
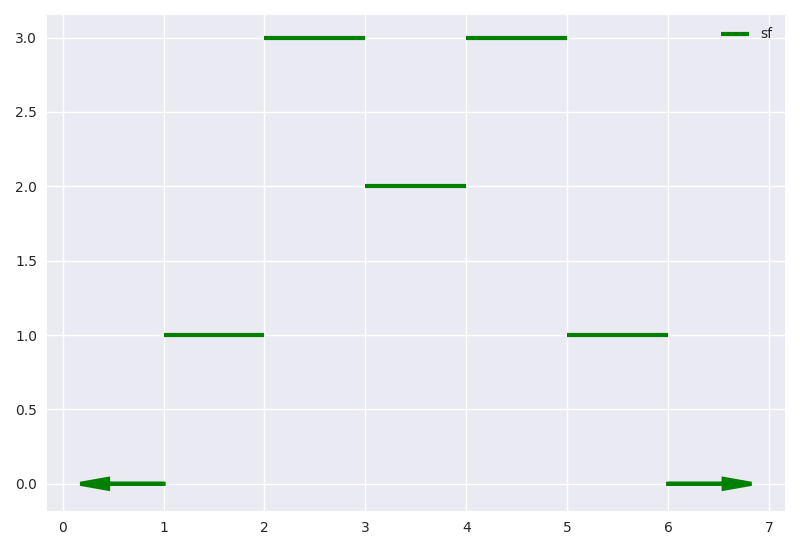
Any additional parameters are passed through through to Matplotlib:
In [7]: ax = sf.plot(arrows=True, style="hlines", linewidth=3, color="green", label="sf")

In [8]: ax.legend();