staircase.Stairs.rolling_mean
-
Stairs.rolling_mean(window=(0, 0), lower=-inf, upper=inf)¶ Returns coordinates defining rolling mean
The rolling mean of a step function is a continous piece-wise linear function, hence it can be described by a sequence of x,y coordinates which mark where function changes gradient. These x,y coordinates are returned as a
pandas.Serieswhich could then be used withmatplotlib.axes.Axes.plot(), or equivalent, to visualise.A rolling mean requires a window around a point x (referred to as the focal point) to be defined. In this implementation the window is defined by two values paired into an array-like parameter called window. These two numbers are the distance from the focal point to the left boundary of the window, and the right boundary of the window respectively. This allows for trailing windows, leading windows and everything between (including a centred window).
If lower or upper is specified then only coordinates corresponding to windows contained within [lower, upper] are included.
Parameters: - window (array-like of int, float or pandas.Timedelta) – should be length of 2. Defines distances from focal point to window boundaries.
- lower (int, float, pandas.Timestamp, or None, default None) – used to indicate the lower bound of the domain of the calculation
- upper (int, float, pandas.Timestamp, or None, default None) – used to indicate the upper bound of the domain of the calculation
Returns: Return type: pandas.SeriesSee also
Examples
>>> s2.rolling_mean(window=[-0.5, 0.5])
-0.5    0.0
 0.5    0.5
 1.5    0.5
 2.5    0.0
 3.5   -1.0
 5.0   -1.0
 6.0    0.0
dtype: float64
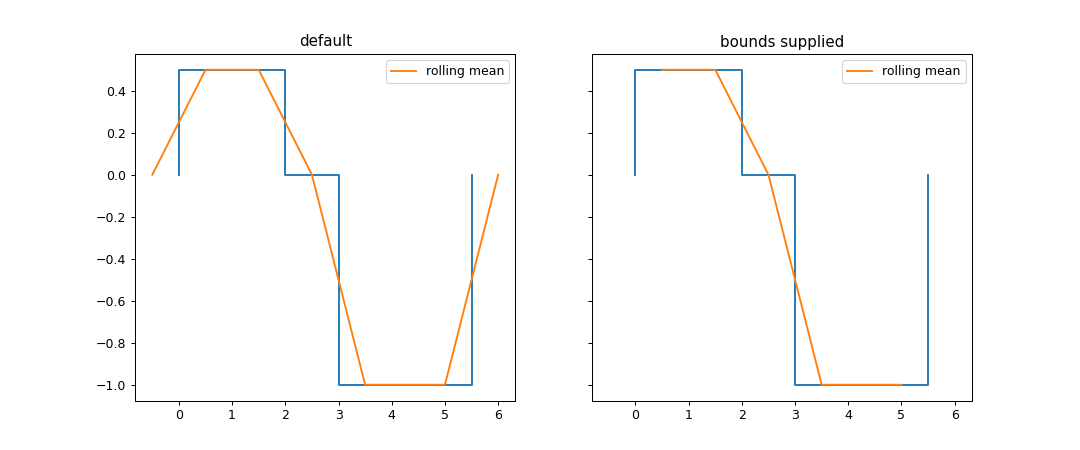
>>> series_list = [s2.rolling_mean(window=[-0.5, 0.5]), s2.rolling_mean(window=[-0.5, 0.5], lower=0, upper = 5.5)]
>>> fig, axes = plt.subplots(nrows=1, ncols=2, figsize=(12,5), sharey=True, sharex=True)
>>> for ax, title, series in zip(axes, ("default", "bounds supplied"), series_list):
...     s2.plot(ax=ax)
...     series.plot(ax=ax, label='rolling mean')
...     ax.set_title(title)
...     ax.legend()
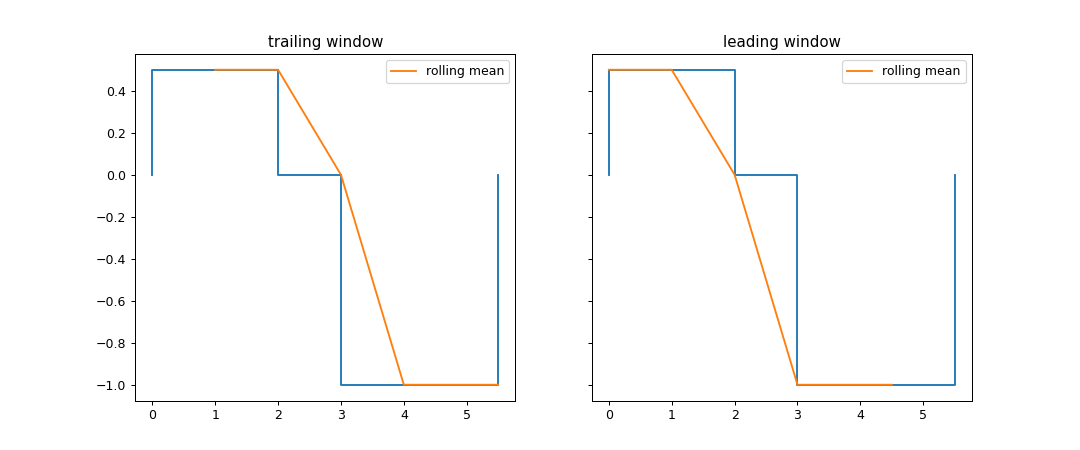
>>> series_list = [s2.rolling_mean(window=[-1, 0], lower=0, upper = 5.5), s2.rolling_mean(window=[0, 1], lower=0, upper = 5.5)]
>>> fig, axes = plt.subplots(nrows=1, ncols=2, figsize=(12,5), sharey=True, sharex=True)
>>> for ax, title, series in zip(axes, ("trailing window", "leading window"), series_list):
...     s2.plot(ax=ax)
...     series.plot(ax=ax, label='rolling mean')
...     ax.set_title(title)
...     ax.legend()