Cookbook
The following cookbook examples assume the following setup
>>> import staircase as sc
>>> import pandas as pd
>>> import numpy as np
General recipes
DataFrame - groupby - apply -> Series
Given a pandas dataframe, whose columns include
arguments for
staircase.Stairs.layer()one, or more, categorical columns which group step functions
a pandas Series of Stairs instances, indexed by groupbys can be obtained like so:
>>> df = sc.make_test_data(groups=list("abc"))
>>> df.groupby("group").apply(sc.Stairs, "start", "end", "value")
group
a    <staircase.Stairs, id=1931375056736>
b    <staircase.Stairs, id=1931366000144>
c    <staircase.Stairs, id=1931373976352>
dtype: object
Merging overlapping events
Suppose a collection of events is defined by start times, and end times, and we wish to merge overlapping events.
>>> # dummy data
>>> starts = np.sort(np.random.uniform(0, 100, 40))
>>> events = pd.DataFrame(
...     {
...         "start":starts,
...         "end": starts + np.random.uniform(0, 4, 40),
...     }
... )

>>> events.head()
start       end
0  0.174828  1.538377
1  0.636105  2.492274
2  2.251498  5.173393
3  5.596381  8.660455
4  7.900132  9.360358

>>> merged_events = (
...     sc.Stairs(events, "start", "end")
...     .make_boolean()
...     .to_frame()
...     .query("value == 1")
...     .drop(columns="value")
... )

>>> merged_events.head()
start        end
1   0.174828   5.173393
3   5.596381   9.360358
5   16.99004  20.552528
7  22.574905  27.741393
9  30.857052  31.043336
Merging overlapping events with gap below threshold
A variant of the above problem, suppose a collection of events is defined by start times, and end times, and we wish to merge overlapping events, or events where the gap between them is less than a certain threshold.
>>> # dummy data
>>> starts = np.sort(np.random.uniform(0, 100, 40))
>>> events = pd.DataFrame(
...     {
...         "start":starts,
...         "end": starts + np.random.uniform(0, 4, 40),
...     }
... )

>>> events.head()
start       end
0  0.174828  1.538377
1  0.636105  2.492274
2  2.251498  5.173393
3  5.596381  8.660455
4  7.900132  9.360358

>>> threshold = 1

>>> merged_events = (
>>>     sc.Stairs(events, "start", "end")
>>>     .make_boolean()
>>>     .to_frame()
>>>     .iloc[1:-1]
>>>     .eval("duration = end - start")
>>>     .query("value == 1 or duration < @threshold")
>>>     .pipe(sc.Stairs, "start", "end")
>>>     .to_frame()
>>>     .query("value == 1")
>>>     .drop(columns="value")
>>> )

>>> merged_events.head()
start        end
1   0.174828   9.360358
3   16.99004  20.552528
5  22.574905  27.741393
7  30.857052  37.126433
9  38.199949   43.50357
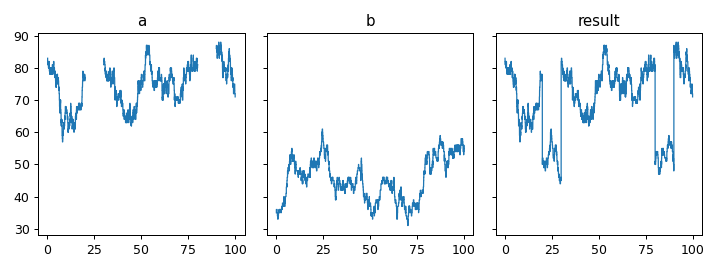
Fill undefined intervals of one step function with another
staircase.Stairs.fillna() allows undefined intervals in a step function to be redefined (i.e. “filled”) with a number. This recipe shows a simple one-liner which fills the undefined values of step function a with the values of step function b.
>>> # test data
>>> def gen_test_step_function(seed):
...     return (
...         sc.make_test_data(dates=False, seed=seed)
...         .pipe(sc.Stairs, "start", "end")
...     )
...
>>> a = gen_test_step_function(0).mask((20,30)).mask((80,90))
>>> b = gen_test_step_function(1)
>>> # recipe
>>> result = a.fillna(0) + b.where(a.isna()).fillna(0)
>>> # plot
>>> fig, axes = plt.subplots(ncols=3, figsize=(8,3), sharex=True, sharey=True)
>>> a.plot(axes[0])
>>> axes[0].set_title("a")
>>> b.plot(axes[1])
>>> axes[1].set_title("b")
>>> result.plot(axes[2])
>>> axes[2].set_title("result")
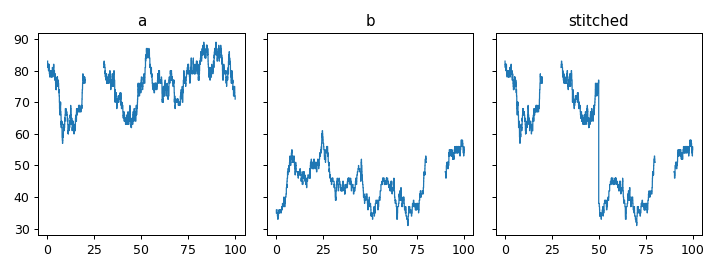
Stitch two step functions together at a point
>>> # test data
>>> def gen_test_step_function(seed):
...     return (
...         sc.make_test_data(dates=False, seed=seed)
...         .pipe(sc.Stairs, "start", "end")
...     )
...
>>> a = gen_test_step_function(0).mask((20,30))
>>> b = gen_test_step_function(1).mask((80,90))
>>> stitch_point = 50
>>> # recipe
>>> # record undefined intervals
>>> a_isna = a.isna().clip(None, stitch_point).fillna(0)
>>> b_isna = b.isna().clip(stitch_point, None).fillna(0)
>>> # stitch together
>>> stitched = (
...     a.clip(None, stitch_point).fillna(0).mask(a_isna)
...     +
...     b.clip(stitch_point, None).fillna(0).mask(b_isna)
... )
>>> # plot
>>> fig, axes = plt.subplots(ncols=3, figsize=(8,3), sharex=True, sharey=True)
>>> a.plot(axes[0])
>>> axes[0].set_title("a")
>>> b.plot(axes[1])
>>> axes[1].set_title("b")
>>> stitched.plot(axes[2])
>>> axes[2].set_title("stitched")
Datetime recipes
Convert step function to time series
Suppose we have a step function sf that we want to convert to a pandas.Series representing a timeseries. In this recipe, we calculate a time series from the daily means
and set the index of the Series to be the a pandas.DatetimeIndex.
>>> sf = sc.make_test_data().pipe(sc.Stairs, "start", "end")
>>> days = pd.period_range("2021", periods=365, freq="D")
>>> time_series = sf.slice(days).mean()
>>> time_series.index = days
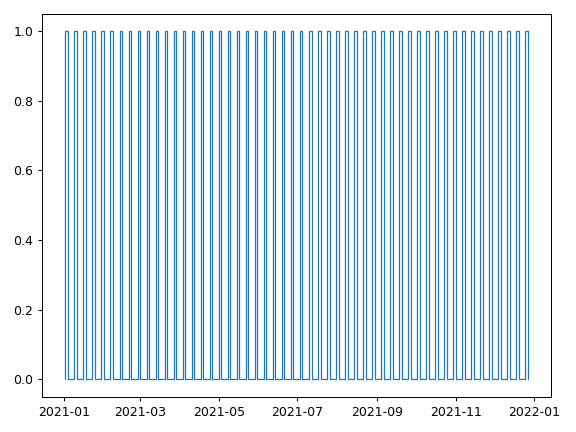
Step function representing weekends
In this recipe we’ll create a boolean valued step function which is 1 whenever it is a weekend in 2021, and 0 otherwise. Note, the first Saturday in 2021 was the 2nd of January.
>>> saturdays = pd.date_range("2021-01-02", "2022", freq="7D", closed="left")
>>> mondays = saturdays + pd.Timedelta(2, "day")
>>> weekend_stairs = sc.Stairs(start=saturdays, end=mondays)
>>> weekend_stairs.plot()
Step function representing 9am to 5pm every day
In this recipe we’ll create a boolean valued step function which is 1 whenever it is between 9am and 5pm (in 2021), and 0 otherwise.
nine_am = pd.date_range("2021-1-1 09:00", "2022", closed="left")
five_pm = pd.date_range("2021-1-1 17:00", "2022", closed="left")
nine_five_stairs = sc.Stairs(start=nine_am, end=five_pm)
Step function representing business hours
In the previous two recipes we created
a step function weekend_stairs which was 1 during weekends, and 0 otherwise
a step function nine_five_stairs which was 1 between 9am to 5pm, and 0 otherwise
If we assume business hours are 9am to 5am, on weekdays then the desired step function is achieved with any of the four calculations:
business_hours_stairs = nine_five_stairs.mask(weekends)

business_hours_stairs = nine_five_stairs.where(~weekends)

business_hours_stairs = nine_five_stairs * ~weekends

business_hours_stairs = nine_five_stairs & ~weekends
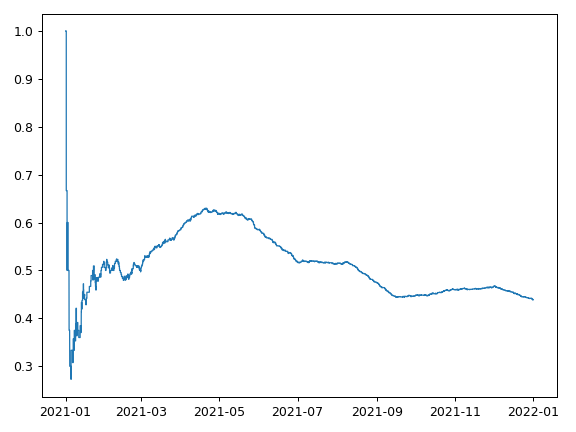
Success rates over time
Suppose we have a set of events, associated with a time and a boolean (success or not). This recipe creates a step function which represents average success rate over time, calculated over 1000 events occurring during the year 2021.
>>> # test data
... def gen_success_rates():
...     arr = np.array([])
...     for i in range(10):
...         av_success_rate = np.random.uniform()
...         arr = np.append(
...             arr,
...             np.random.choice([False, True], 100, p=[1-av_success_rate, av_success_rate]),
...         )
...     return arr
...
>>> times = (
...     pd.Timestamp("2021") +
...     pd.Series(np.random.randint(0,365*24, 1000)).apply(pd.Timedelta, unit="H")
... )
...
>>> events = pd.DataFrame(
...     {
...         "time": np.sort(times),
...         "success": gen_success_rates(),
...     }
... )
>>> # recipe
>>> count_successful = sc.Stairs(events.query("success == 1"), start="time")
>>> count_all = sc.Stairs(events, start="time")
>>> success_rate = count_successful/count_all
>>> success_rate.plot()
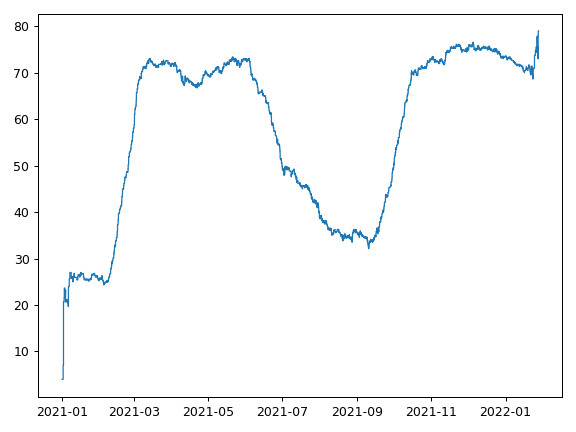
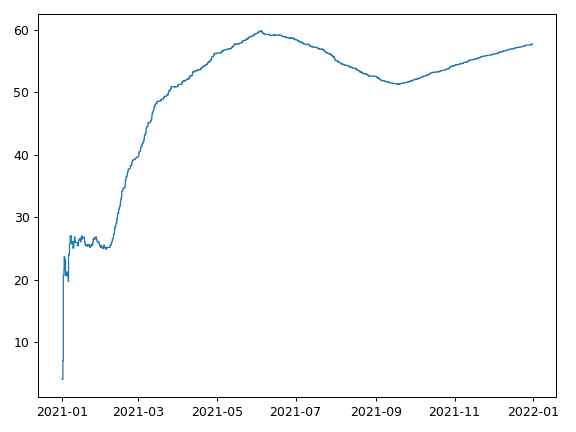
Average over time
The following recipe is a generalisation of the above recipe for success rates, and does not introduce anything fundamentally new.
Suppose we have a set of events, associated with a time and a number. This recipe creates a step function which represents the average over time, calculated over 1000 events occurring during the year 2021.
>>> # test data
>>> rng = np.random.default_rng(seed=0)  # seed random number generator
>>> def gen_values():
...    arr = np.array([])
...    for i in range(10):
...        bound = rng.integers(0,100)
...        bounds = (bound, 100) if bound < 50 else (0, bound)
...        arr = np.append(
...            arr,
...            rng.integers(*bounds, 100)
...        )
...    return arr
...
>>> times = (
...     pd.Timestamp("2021") +
...     pd.Series(rng.integers(0,365*24, 1000)).apply(pd.Timedelta, unit="H")
... )
...
>>> events = pd.DataFrame(
...     {
...         "time": np.sort(times),
...         "value": gen_values(),
...     }
... )
>>> # recipe
>>> sum_over_time = sc.Stairs(events, start="time", value="value")
>>> count_over_time = sc.Stairs(events, start="time")
>>> average_over_time = sum_over_time/count_over_time
>>> average_over_time.plot()
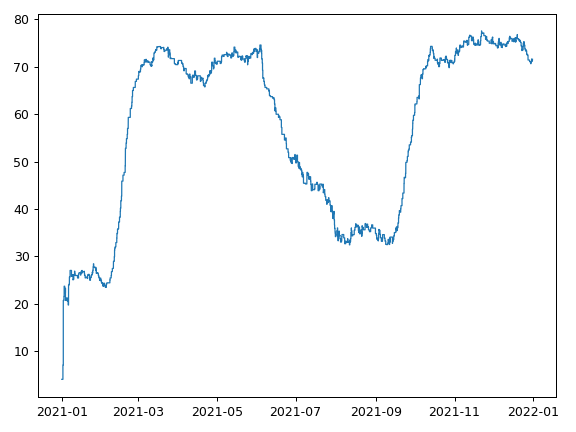
Rolling average over time (trailing window n events)
Suppose we have a set of events, associated with a time and a number. This recipe creates a step function which represents the rolling average over time, calculated over 1000 events occurring during the year 2021. The rolling average is calculated with a trailing window which averages the latest n events. In the recipe below n = 50.
>>> # test data
>>> rng = np.random.default_rng(seed=0)  # seed random number generator
>>> def gen_values():
...    arr = np.array([])
...    for i in range(10):
...        bound = rng.integers(0,100)
...        bounds = (bound, 100) if bound < 50 else (0, bound)
...        arr = np.append(
...            arr,
...            rng.integers(*bounds, 100)
...        )
...    return arr
...
>>> times = (
...     pd.Timestamp("2021") +
...     pd.Series(rng.integers(0,365*24, 1000)).apply(pd.Timedelta, unit="H")
... )
...
>>> events = pd.DataFrame(
...     {
...         "time": np.sort(times),
...         "value": gen_values(),
...     }
... )
>>> # recipe
>>> n = 50
>>> end = events["time"].shift(-n)
>>> rolling_sum_over_time = sc.Stairs(events, start="time", end=end, value="value")
>>> rolling_count_over_time = sc.Stairs(events, start="time", end=end)
>>> rolling_average_over_time = rolling_sum_over_time/rolling_count_over_time
>>> rolling_average_over_time.plot()
Rolling average over time (trailing window, time based)
Suppose we have a set of events, associated with a time and a number. This recipe creates a step function which represents the rolling average over time, calculated over 1000 events occurring during the year 2021. The rolling average is calculated with a trailing time based window. The window in the recipe below is 28 days.
>>> # test data
>>> rng = np.random.default_rng(seed=0)  # seed random number generator
>>> def gen_values():
...    arr = np.array([])
...    for i in range(10):
...        bound = rng.integers(0,100)
...        bounds = (bound, 100) if bound < 50 else (0, bound)
...        arr = np.append(
...            arr,
...            rng.integers(*bounds, 100)
...        )
...    return arr
...
>>> times = (
...     pd.Timestamp("2021") +
...     pd.Series(rng.integers(0,365*24, 1000)).apply(pd.Timedelta, unit="H")
... )
...
>>> events = pd.DataFrame(
...     {
...         "time": np.sort(times),
...         "value": gen_values(),
...     }
... )
>>> # recipe
>>> end = events["time"] + pd.Timedelta(28, "D")
>>> rolling_sum_over_time = sc.Stairs(events, start="time", end=end, value="value")
>>> rolling_count_over_time = sc.Stairs(events, start="time", end=end)
>>> rolling_average_over_time = rolling_sum_over_time/rolling_count_over_time
>>> rolling_average_over_time.plot()