staircase.Stairs.layer#
- Stairs.layer(start=None, end=None, value=None, frame=None)#
Changes the values of the step function, in place, by ‘layering’ one or more intervals.
The values of start, end and value parameters can be one of several types. If any of these is a string, then it is expected that frame is a
pandas.DataFrameand the string is the name of a column in the dataframe.If either start, or end evaluate to an array-like parameter then all of start, end, and value will be broadcast to the same length as the longest of these arrays.
- Parameters
- startscalar, array-like or string, default None
Start point(s) of the interval(s). A value of None is interpreted as negative infinity.
- endscalar, array-like or string, default None
End points(s) of the interval(s). A value of None is interpreted as positive infinity.
- valuefloat, array-like or string, default None
Value(s) of the interval(s). A value of None is equivalent to a value of 1.
- frame
pandas.DataFrame, optional A dataframe containing named columns, whose names may appear as values for the other parameters.
- Returns
StairsThe current instance is returned to facilitate method chaining
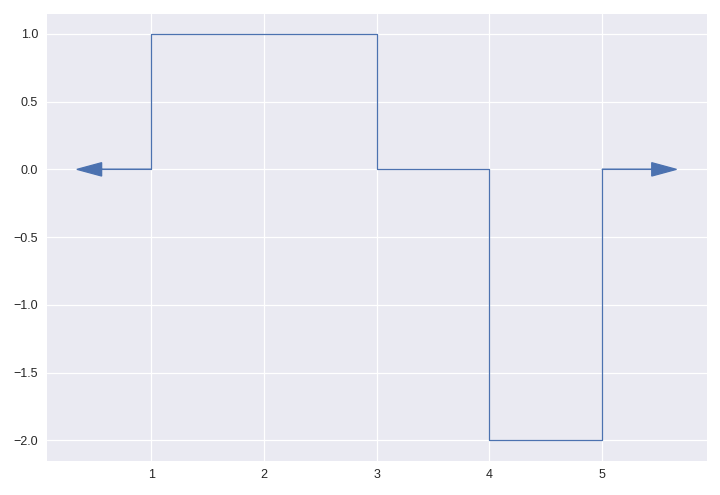
Examples
>>> import staircase as sc
... (
...     sc.Stairs()
...     .layer(1,3)
...     .layer(4,5,-2)
...     .plot(arrows=True)
... )
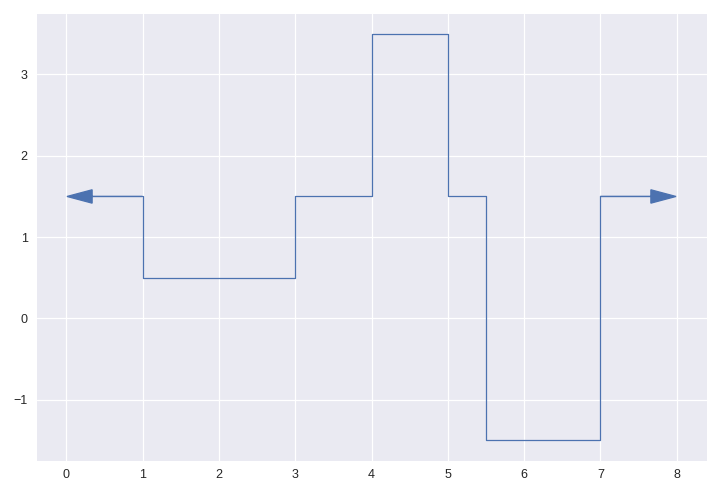
>>> import pandas as pd
>>> import staircase as sc
>>> data = pd.DataFrame({"starts":[1,4,5.5],
...                      "ends":[3,5,7],
...                      "values":[-1,2,-3]})
>>> data
starts  ends  values
0     1.0     3      -1
1     4.0     5       2
2     5.5     7      -3
>>> (
...     sc.Stairs(initial_value=1.5)
...     .layer(data["starts"], data["ends"], data["values"])
...     .plot(arrows=True)
... )

>>> import pandas as pd
>>> import staircase as sc
>>> data = pd.DataFrame({"starts":[1,4,5.5],
...                      "ends":[3,5,7],
...                      "values":[-1,2,-3]})
>>> data
starts  ends  values
0     1.0     3      -1
1     4.0     5        2
2     5.5     7     -3
>>> (
...     sc.Stairs(initial_value=1.5)
...     .layer("starts", "ends", "values", frame=data)
...     .plot(arrows=True)
... )