
staircase.Stairs.describe#
- Stairs.describe(where: tuple[float | int, float | int] | list[float | int, float | int] = (<staircase.constants.NegInf object>, <staircase.constants.Inf object>), percentiles: list[float | int] | tuple[float | int] = (25, 50, 75)) Series#
Generate descriptive statistics for the step function values over a specified domain.
- Parameters:
- wheretuple or list of length two, optional
Indicates the domain interval over which to evaluate the step function. Default is (-sc.inf, sc.inf) or equivalently (None, None).
- percentiles: array-like of float, default [25, 50, 70]
The percentiles to include in output. Numbers should be in the range 0 to 100.
- Returns:
See also
Examples
>>> s2.plot(arrows=True)
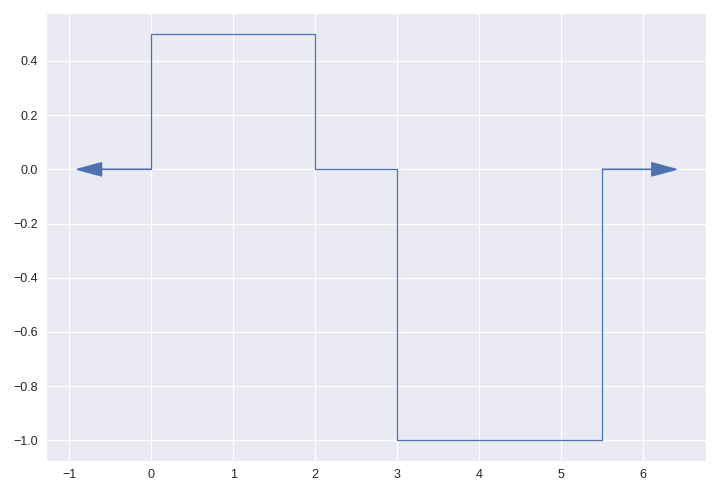
>>> s2.describe()
unique    3.000000
mean     -0.272727
std       0.686349
min      -1.000000
25%      -1.000000
50%       0.000000
75%       0.500000
max       0.500000
dtype: float64
>>> s2.describe(where=(0,6), percentiles=np.linspace(0,100,6))
unique    3.000000
mean     -0.250000
std       0.661438
min      -1.000000
0%       -1.000000
20%      -1.000000
40%      -1.000000
60%       0.000000
80%       0.500000
100%      0.500000
max       0.500000
dtype: float64