
staircase.Stairs.hist#
- Stairs.hist(bins='unit', closed='left', stat='sum')#
Calculates histogram data for the corresponding step function values
- Parameters:
- bins“unit”, sequence or
pandas.IntervalIndex If bins is “unit” then the histogram bins will have unit length and cover the range of step function values. If bins is a sequence, it defines a monotonically increasing array of bin edges. If bins are defined by
pandas.IntervalIndexthey should be non-overlapping and monotonic increasing.- closed{“left”, “right”}, default “left”
Indicates whether the histogram bins are left-closed right-open or right-closed left-open. Only relevant when bins is not a
pandas.IntervalIndex- stat{“sum”, “frequency”, “density”, “probability”}, default “sum”
- The aggregate statistic to compute in each bin. Inspired by
seaborn.histplot()stat parameter. sumthe magnitude of observationsfrequencyvalues of the histogram are divided by the corresponding bin widthdensitynormalises values of the histogram so that the area is 1probabilitynormalises values so that the histogram values sum to 1
- The aggregate statistic to compute in each bin. Inspired by
- bins“unit”, sequence or
- Returns:
Examples
>>> s1.plot(arrows=True)
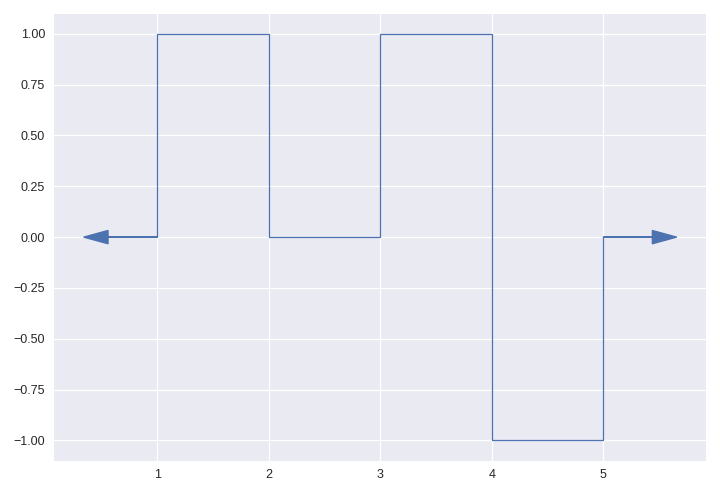
>>> s1.hist()
[-1, 0)    1.0
[0, 1)     1.0
[1, 2)     2.0
dtype: float64
>>> s1.hist(closed="right")
(-2, -1]    1.0
(-1, 0]     1.0
(0, 1]      2.0
dtype: float64
>>> s1.hist(bins=[-1,1,2])
[-1, 1)    2.0
[1, 2)     2.0
dtype: float64
>>> s1.hist(bins=[-1,1,2], stat="frequency")
[-1, 1)    1.0
[1, 2)     2.0
dtype: float64
>>> s1.hist(bins=[-1,1,2], stat="density")
[-1, 1)    0.333333
[1, 2)     0.333333
dtype: float64
>>> s1.hist(bins=[-1,1,2], stat="probability")
[-1, 1)    0.5
[1, 2)     0.5
dtype: float64