
Case study: asset utilisation#
This case study illustrates the use of the staircase package for analysing asset utilisation. In this example we have a group of 3 identical assets, X, Y, and Z. These assets are parallel ‘machines’, such as bays in a carwash, or buses in a fleet etc. Each asset can either be in one of two states - on or off (or alternatively working or not working).
We begin by importing the asset data into a pandas.DataFrame instance. Each row corresponds to a period of time that an asset is being used. The first column identifies the asset, while the second and third columns give the start and end times of the period of use respectively.
In [1]: import pandas as pd

In [2]: import staircase as sc

In [3]: data = pd.read_csv(asset_data, parse_dates=['start', 'end'])

In [4]: data
Out[4]:
      asset               start                 end
0         Y 2020-01-01 00:06:00 2020-01-01 00:21:00
1         Z 2020-01-01 00:50:00 2020-01-01 01:39:00
2         Y 2020-01-01 00:54:00 2020-01-01 01:51:00
3         Z 2020-01-01 02:14:00 2020-01-01 03:03:00
4         Y 2020-01-01 02:29:00 2020-01-01 03:26:00
...     ...                 ...                 ...
15079     Z 2020-12-31 19:28:00 2020-12-31 20:17:00
15080     Y 2020-12-31 20:59:00 2020-12-31 21:14:00
15081     Y 2020-12-31 22:15:00 2020-12-31 22:37:00
15082     Z 2020-12-31 22:40:00 2020-12-31 23:29:00
15083     Y 2020-12-31 22:50:00 2020-12-31 23:47:00

[15084 rows x 3 columns]
For the analysis we would like a staircase.Stairs object for each asset. Each Stairs object will represent a step function which has a value of zero, when the asset is not in use, and a value of one when the asset is in use. We can pandas’ groupby process (“split-apply-combine”) with the staircase.Stairs constructor method to get a pandas.Series, indexed by asset name, with staircase.Stairs values:
In [5]: asset_use = data.groupby("asset")[["start", "end"]].apply(sc.Stairs, start="start", end="end")

In [6]: asset_use
Out[6]:
asset
X    <staircase.Stairs, id=124855367954384>
Y    <staircase.Stairs, id=124855368939472>
Z    <staircase.Stairs, id=124855367844880>
dtype: object
Note that since we want to examine 2020 we clip the step function at the year endpoints, making the functions undefined for any time outside of 2020 (see Gotchas for why this is a good idea). pandas.Series.apply() is used here, rather than looping, for efficiency.
In [7]: asset_use = asset_use.apply(sc.Stairs.clip, args=(pd.Timestamp("2020"), pd.Timestamp("2021")))
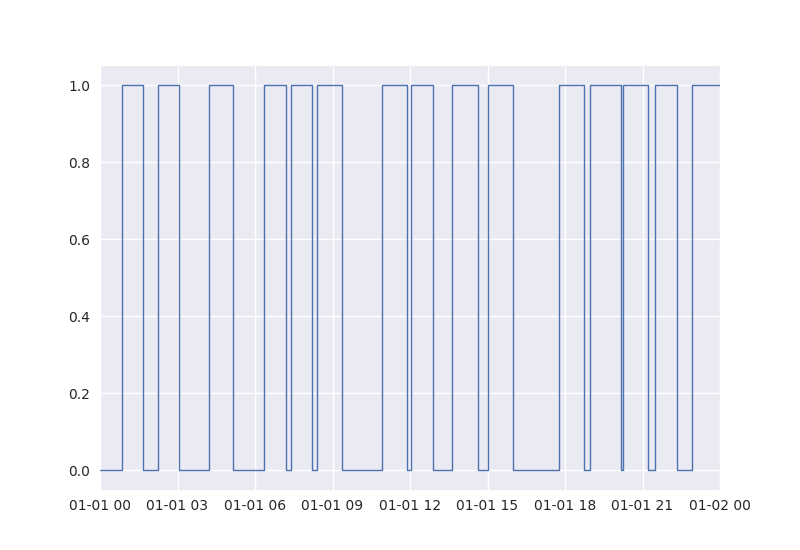
We can access an individual staircase.Stairs object with the corresponding asset name. For example, to plot the step function corresponding to asset Z, for the first day:
In [8]: ax = asset_use['Z'].plot()

In [9]: ax.set_xlim('2020-1-1', '2020-1-2');
Because these assets belong to a group, we are interested in their combined utilisation, i.e. the addition of the three step functions. This can be achieved by simply summing up the staircase.Stairs objects, and results in another staircase.Stairs object (assigned to combined_asset_use):
In [10]: combined_asset_use = asset_use['X'] + asset_use['Y'] + asset_use['Z']
Note that we can also achieve the same result by leveraging the pandas.Series.sum() method, or preferably staircase.sum() (a more efficient method for staircase.Stairs objects).
Using the staircase.Stairs.integral() method we can see that the three assets together worked for a total of ~13,172 hours in the year 2020.
In [11]: combined_asset_use.integral()
Out[11]: Timedelta('548 days 19:56:00')

In [12]: combined_asset_use.integral()/pd.Timedelta("1 hour")
Out[12]: 13171.933333333332
Given there are 3 assets, and 8784 hours in the year 2020, there are a total of 26,352 hours that the assets could have worked - approximately double the hours used. It is not surprising then that calculating the average group utilisation for the year 2020 is approximately 1.5
In [13]: combined_asset_use.mean()
Out[13]: 1.4995370370370371
Now we will look to discover how often exactly none of the assets were being used. If we compare combined_asset_use to 0, then the result is also staircase.Stairs instance. This object represents a binary (or boolean) valued step function, which takes value 1 whenever there are 0 assets being used.
In [14]: combined_asset_use == 0
Out[14]: <staircase.Stairs, id=124855367708688>
The question, of how often none of the assets are being used, can be answered with the staircase.Stairs.mean() method:
In [15]: (combined_asset_use == 0).mean()
Out[15]: 0.12352572859744991
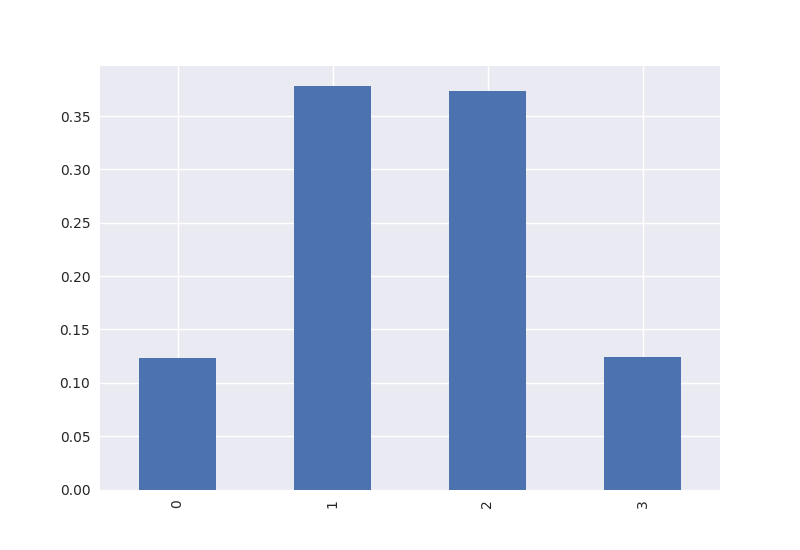
So all assets are idle, during 2020, approximately 12.3% of the time. If we wish to further this idea by extending to 1, 2, or 3 assets being used, then the staircase.Stairs.hist() method can perform the calculation efficiently.
In [16]: combined_utilisation = combined_asset_use.hist(stat="probability")

In [17]: combined_utilisation
Out[17]:
[0, 1)    0.123526
[1, 2)    0.378038
[2, 3)    0.373810
[3, 4)    0.124626
dtype: float64
We can also use the pandas.Series plotting methods to get a quick visual of this utilisation breakdown:
In [18]: combined_utilisation.index = combined_utilisation.index.left

In [19]: combined_utilisation.plot.bar()
Out[19]: <Axes: >
We now show how to answer a variety of miscellaneous questions for the purposes of demonstration:
How often is X working while Y is not?
In [20]: (asset_use["X"] > asset_use["Y"]).mean()
Out[20]: 0.25360314207650275
How many assets were being used at 9:40am on the 5th of September?
In [21]: combined_asset_use(pd.Timestamp(2020, 9, 5, 9, 40))
Out[21]: np.float64(2.0)
Which 2 assets were being used at this time?
In [22]: asset_use.apply(lambda s: s(pd.Timestamp(2020, 9, 5, 9, 40)))
Out[22]:
asset
X    1.0
Y    1.0
Z    0.0
dtype: float64
If we’d prefer to work with “idleness”, instead of “in use”, we can create a staircase.Stairs object to capture this by simply subtracting the “in use” step function from the number of assets (3):
In [23]: combined_assets_idle = 3 - combined_asset_use
The number of assets idle at 9:40am on the 5th of September should be 1 right? Let’s check:
In [24]: combined_assets_idle(pd.Timestamp(2020, 9, 5, 9, 40))
Out[24]: np.float64(1.0)